Read your analytics dashboard
The dashboard turns every chat into numbers you can act on. Open it to see how busy the bot is, how well it is doing, and, most usefully, what people keep asking.
Start with the headline numbers
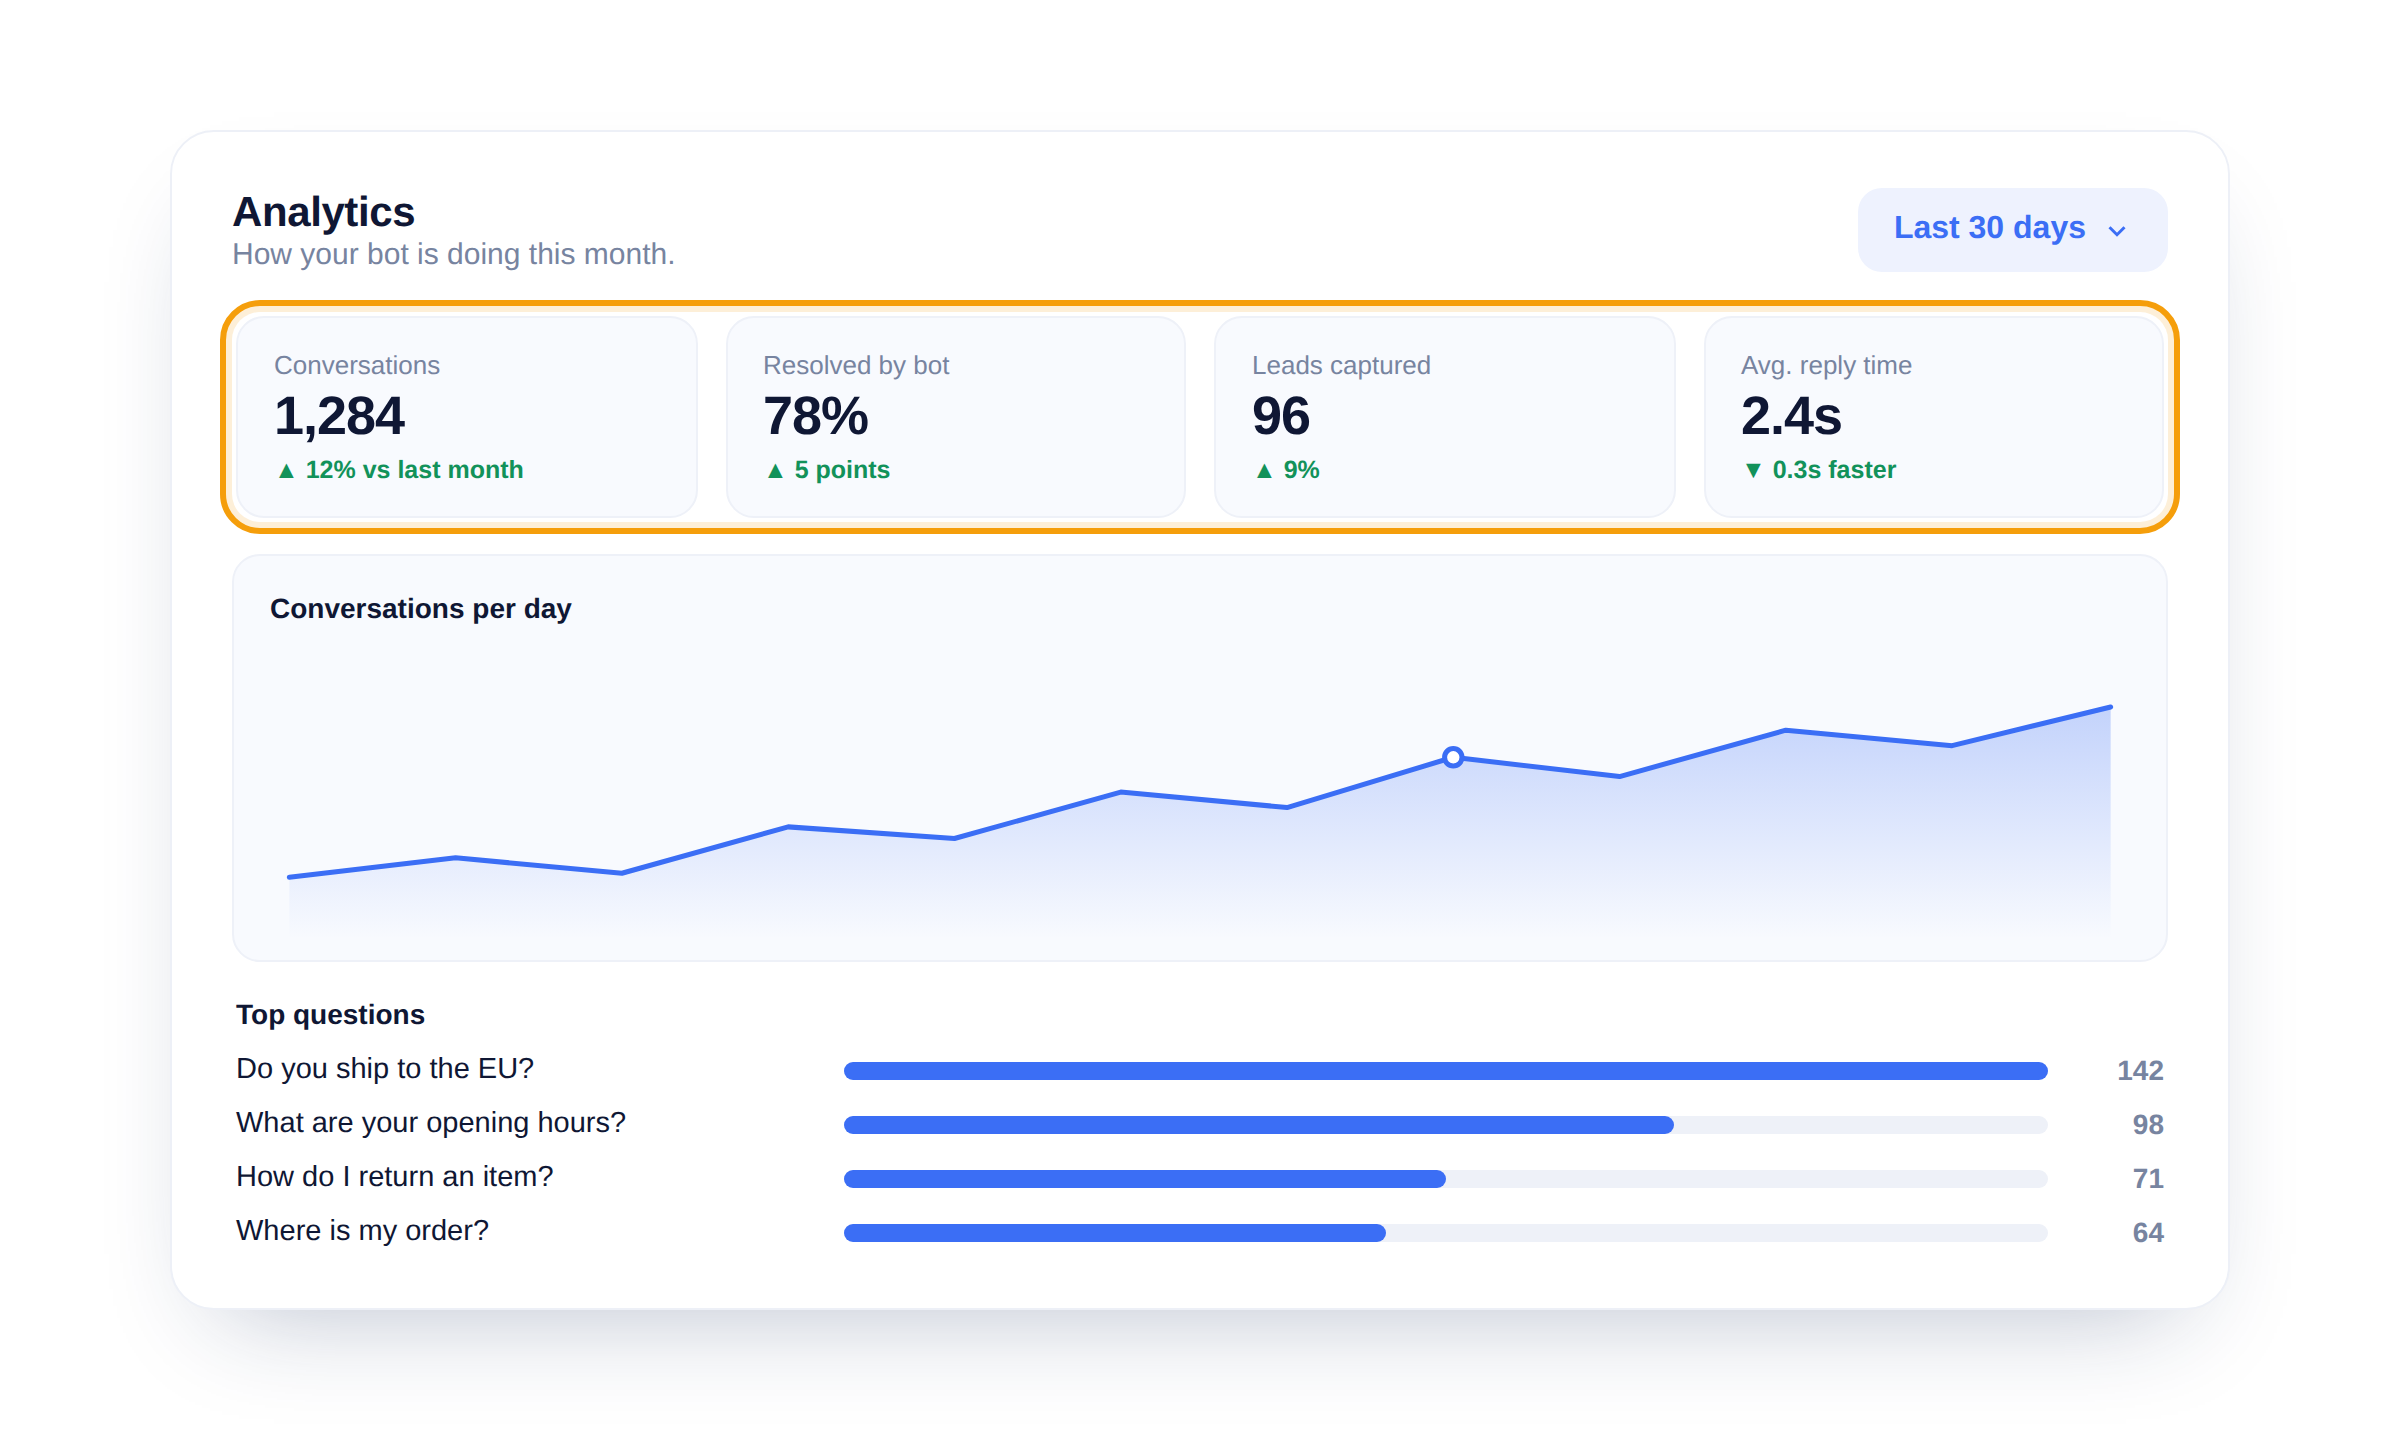
The cards along the top give you the month at a glance: total conversations, the share resolved by the bot without a human, leads captured, and average reply time. Each shows the change since last month, so a dip is easy to spot.
Find your top questions
The top questions list is the gold. It shows exactly what visitors ask most, ranked. If a question near the top gets weak answers, that is the first thing to fix in your knowledge base.
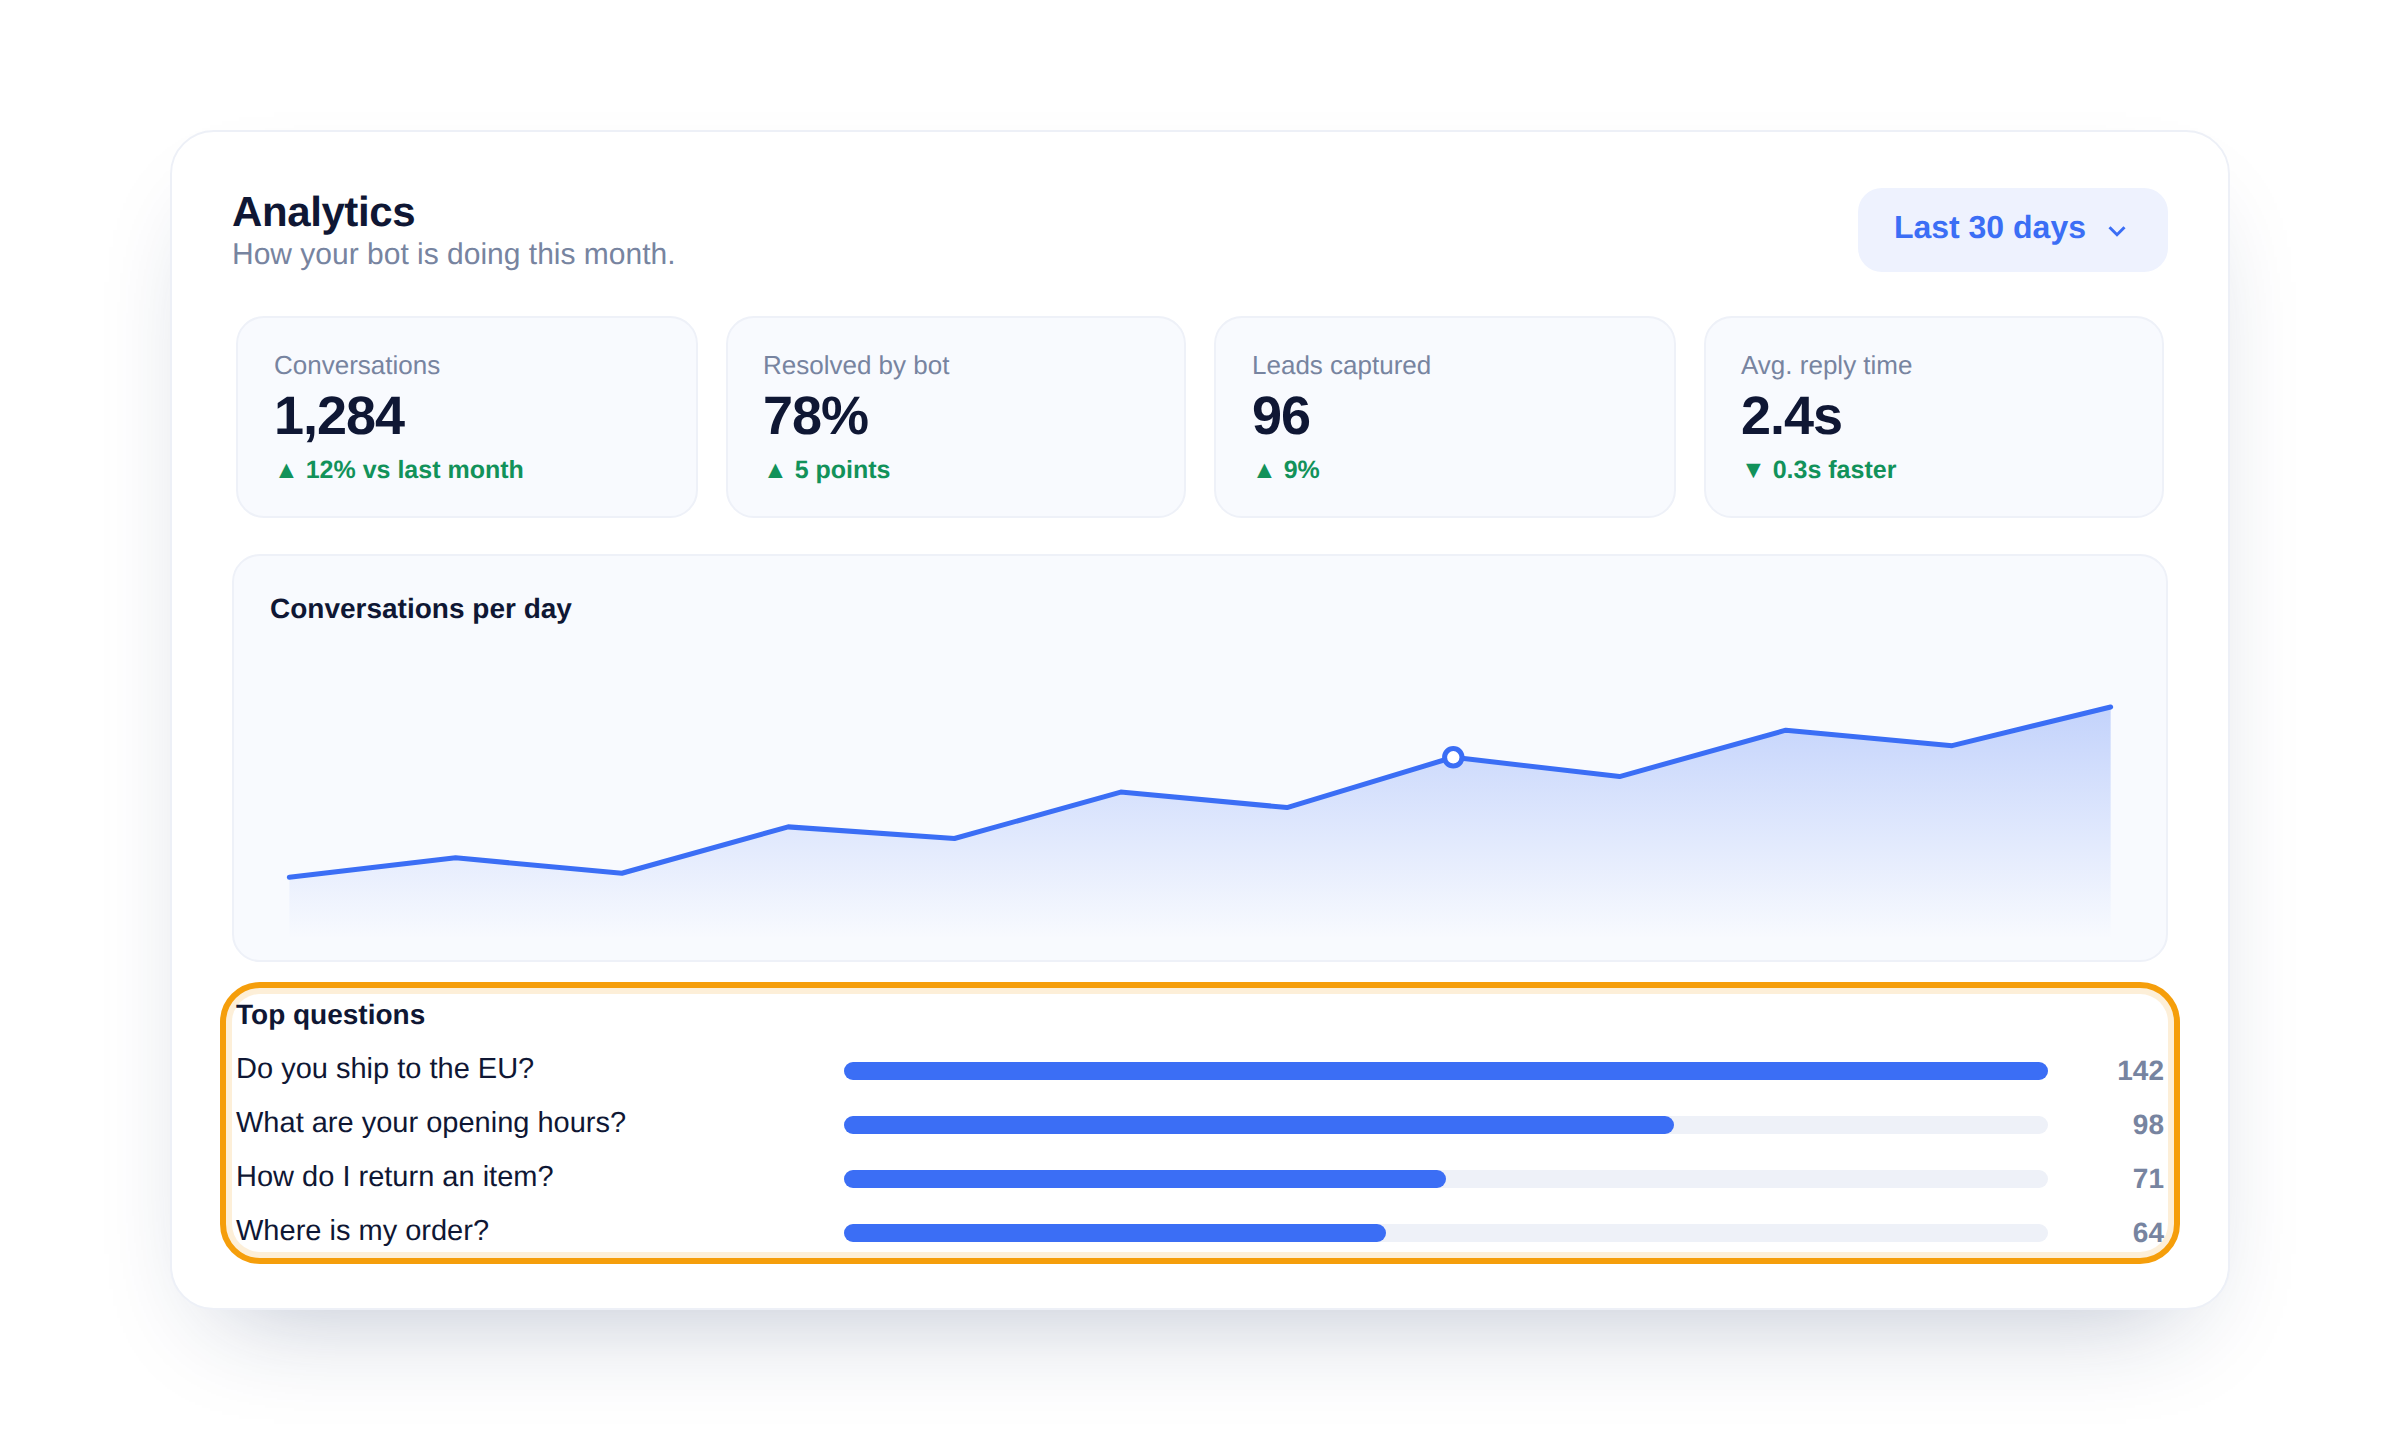
A common question with a shaky answer costs you the most. Work the top of this list first, add a FAQ or a page for it, and you improve the most conversations with the least effort.